Data Visualisation Jobs with Hybrid/Remote/WFH Options

Data Visualization
UK > Work from Home

The table below provides summary statistics for permanent remote or hybrid work requiring Data Visualisation skills. It includes a benchmarking guide to the annual salaries offered in vacancies that cited Data Visualisation over the 6 months leading up to 26 August 2025, comparing them to the same period in the previous two years.

6 months to
26 Aug 2025
Same period 2024 Same period 2023
Rank 265 237 239
Rank change year-on-year -28 +2 -18
DemandTrendPermanent jobs citing Data Visualisation 213 343 398
As % of all permanent jobs with a WFH option 1.05% 1.30% 1.37%
As % of the Processes & Methodologies category 1.13% 1.47% 1.43%
Number of salaries quoted 133 207 328
10th Percentile £38,869 £39,829 £39,294
25th Percentile £45,000 £52,125 £47,447
Median annual salary (50th Percentile) £55,000 £65,000 £60,000
Median % change year-on-year -15.38% +8.33% +9.09%
75th Percentile £70,000 £80,000 £80,625
90th Percentile £87,250 £85,000 £88,750
UK median annual salary £55,000 £65,000 £60,000
% change year-on-year -15.38% +8.33% +4.35%

All Process and Methodology Skills
Work from Home

Data Visualisation falls under the Processes and Methodologies category. For comparison with the information above, the following table provides summary statistics for all permanent job vacancies with remote or hybrid options requiring process or methodology skills.

DemandTrendPermanent vacancies with a requirement for process or methodology skills 18,895 23,316 27,889
As % of all permanent jobs with a WFH option 93.16% 88.23% 95.82%
Number of salaries quoted 9,560 14,922 20,779
10th Percentile £25,203 £35,000 £37,500
25th Percentile £37,170 £43,750 £47,500
Median annual salary (50th Percentile) £55,000 £60,000 £62,500
Median % change year-on-year -8.33% -4.00% +2.46%
75th Percentile £76,250 £78,750 £81,250
90th Percentile £98,474 £97,500 £100,000
UK median annual salary £55,000 £55,000 £60,000
% change year-on-year - -8.33% -

Data Visualisation
Trend for Jobs with a WFH Option

Job vacancies with remote working options citing Data Visualisation as a proportion of all IT jobs advertised.
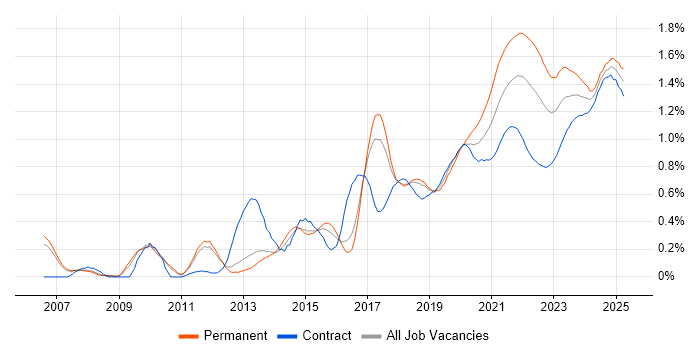
Data Visualisation trend for jobs with Hybrid/Remote/WFH options

Data Visualisation
Salary Trend for Jobs with Hybrid Work Options

Salary distribution trend for jobs with remote work options citing Data Visualisation.

Salary distribution trend for jobs with remote work options citing Data Visualisation

Data Visualisation
Salary Histogram for Jobs with a WFH Option

Salary distribution for jobs with remote working options citing Data Visualisation over the 6 months to 26 August 2025.

Data Visualisation salary histogram for jobs with a WFH option

Data Visualisation
Co-occurring Skills and Capabilities with WFH Options by Category

The follow tables expand on the table above by listing co-occurrences grouped by category. The same employment type, locality and period is covered with up to 20 co-occurrences shown in each of the following categories:

Application Platforms
1 8 (3.76%) Apache Spark
2 5 (2.35%) SharePoint
3 3 (1.41%) Confluence
4 2 (0.94%) ArcGIS
4 2 (0.94%) SAS
5 1 (0.47%) Apache
5 1 (0.47%) Apache Airflow
5 1 (0.47%) Drupal
Applications
1 53 (24.88%) Microsoft Excel
2 10 (4.69%) Microsoft Office
3 5 (2.35%) Spreadsheet
4 3 (1.41%) MS Visio
5 2 (0.94%) Adobe Illustrator
5 2 (0.94%) Photoshop
6 1 (0.47%) Adobe Creative Suite
6 1 (0.47%) Adobe Premiere
6 1 (0.47%) InDesign
6 1 (0.47%) SPSS
Business Applications
1 11 (5.16%) NetSuite
2 4 (1.88%) Salesforce CRM
3 3 (1.41%) Dynamics CRM
4 2 (0.94%) Dynamics GP
4 2 (0.94%) SAP Oil and Gas
Cloud Services
1 132 (61.97%) Power Platform
2 70 (32.86%) Azure
3 22 (10.33%) Snowflake
4 21 (9.86%) Azure Data Factory
5 20 (9.39%) GCP
6 17 (7.98%) Power Automate
7 16 (7.51%) AWS
8 14 (6.57%) Google Analytics
9 12 (5.63%) Azure Synapse Analytics
10 11 (5.16%) PowerApps
10 11 (5.16%) SaaS
11 8 (3.76%) Dynamics 365
11 8 (3.76%) Microsoft 365
12 7 (3.29%) Azure DevOps
13 5 (2.35%) dbt
14 4 (1.88%) Adobe Analytics
14 4 (1.88%) Azure Stack
14 4 (1.88%) Fivetran
14 4 (1.88%) Google Tag Manager
14 4 (1.88%) Zapier
Communications & Networking
1 1 (0.47%) Internet
Database & Business Intelligence
1 132 (61.97%) Power BI
2 76 (35.68%) Tableau
3 33 (15.49%) Data Warehouse
4 20 (9.39%) BigQuery
5 18 (8.45%) Looker
6 15 (7.04%) Big Data
7 12 (5.63%) Oracle Reports
8 11 (5.16%) SQL Server Integration Services
9 8 (3.76%) Data Lake
9 8 (3.76%) Power Query
9 8 (3.76%) SQL Server
9 8 (3.76%) SQL Server Reporting Services
10 7 (3.29%) GIS
10 7 (3.29%) SAP BW
11 6 (2.82%) Amazon Redshift
11 6 (2.82%) Azure SQL Data Warehouse
12 5 (2.35%) Data Hub
12 5 (2.35%) Enterprise Data Warehouse
12 5 (2.35%) PostgreSQL
12 5 (2.35%) Relational Database
Development Applications
1 5 (2.35%) JIRA
2 3 (1.41%) Jenkins
2 3 (1.41%) SQL Server Management Studio (SSMS)
2 3 (1.41%) Visual Studio
3 2 (0.94%) MSTest
3 2 (0.94%) NUnit
3 2 (0.94%) SpecFlow
3 2 (0.94%) TeamCity
4 1 (0.47%) Gatling
4 1 (0.47%) JMeter
4 1 (0.47%) Locust
4 1 (0.47%) MLflow
4 1 (0.47%) Postman
General
1 84 (39.44%) Finance
2 81 (38.03%) Analytical Skills
3 68 (31.92%) Social Skills
4 26 (12.21%) Marketing
5 20 (9.39%) Public Sector
6 15 (7.04%) Inclusion and Diversity
7 14 (6.57%) Banking
7 14 (6.57%) Legal
8 12 (5.63%) Retail
9 11 (5.16%) Law
9 11 (5.16%) Manufacturing
10 6 (2.82%) Games
10 6 (2.82%) Local Government
11 4 (1.88%) Social Housing
12 3 (1.41%) Advertising
12 3 (1.41%) Financial Institution
12 3 (1.41%) Influencing Skills
12 3 (1.41%) Military
12 3 (1.41%) Telecoms
13 2 (0.94%) Front Office
Job Titles
1 57 (26.76%) Analyst
2 40 (18.78%) Developer
3 35 (16.43%) Senior
4 29 (13.62%) Data Engineer
5 18 (8.45%) Data Analyst
6 17 (7.98%) Business Intelligence Developer
6 17 (7.98%) Data Manager
7 16 (7.51%) Lead
8 11 (5.16%) Analytics Manager
8 11 (5.16%) Business Intelligence Analyst
8 11 (5.16%) Power BI Developer
9 10 (4.69%) Accountant
9 10 (4.69%) Senior Analyst
9 10 (4.69%) Senior Developer
9 10 (4.69%) Systems Accountant
10 9 (4.23%) Business Analyst
11 8 (3.76%) Junior
11 8 (3.76%) Power Platform Developer
12 7 (3.29%) Azure Data Engineer
12 7 (3.29%) Insight Manager
Libraries, Frameworks & Software Standards
1 8 (3.76%) PySpark
2 6 (2.82%) CSS
2 6 (2.82%) HTML
3 5 (2.35%) REST
4 4 (1.88%) HTML5 Canvas
4 4 (1.88%) JSON
5 3 (1.41%) .NET
5 3 (1.41%) Kafka
5 3 (1.41%) Pandas
5 3 (1.41%) Plotly
5 3 (1.41%) PyTorch
5 3 (1.41%) TensorFlow
6 2 (0.94%) CSS3
6 2 (0.94%) Electron
6 2 (0.94%) FastAPI
6 2 (0.94%) HTML5
6 2 (0.94%) Lightning Web Components
6 2 (0.94%) Oracle Fusion
6 2 (0.94%) Reactive Extensions
6 2 (0.94%) WPF
Miscellaneous
1 16 (7.51%) Management Information System
2 6 (2.82%) Algorithms
2 6 (2.82%) Cloud Native
2 6 (2.82%) Derivative
2 6 (2.82%) Onboarding
2 6 (2.82%) Social Media
3 5 (2.35%) Greenfield Project
3 5 (2.35%) Virtual Team
4 4 (1.88%) Freedom of Information
4 4 (1.88%) Hackathon
5 3 (1.41%) Analytical Mindset
5 3 (1.41%) Fixed Income
5 3 (1.41%) Housing Association
5 3 (1.41%) NHS
5 3 (1.41%) Podcast
5 3 (1.41%) Self-Motivation
5 3 (1.41%) Taxonomies
6 2 (0.94%) Data Protection Act
6 2 (0.94%) Lidar
6 2 (0.94%) Product Ownership
Operating Systems
1 5 (2.35%) Windows
2 3 (1.41%) Linux
2 3 (1.41%) Unix
Processes & Methodologies
1 213 (100.00%) Visualisation
2 126 (59.15%) Business Intelligence
3 104 (48.83%) Analytics
4 94 (44.13%) Decision-Making
5 69 (32.39%) Problem-Solving
6 51 (23.94%) Data Analysis
7 50 (23.47%) Data Modelling
8 41 (19.25%) Actionable Insight
9 36 (16.90%) ETL
10 29 (13.62%) Continuous Improvement
10 29 (13.62%) Data Management
11 28 (13.15%) Mentoring
12 26 (12.21%) Agile
12 26 (12.21%) Data Analytics
12 26 (12.21%) DevOps
13 25 (11.74%) Project Management
14 23 (10.80%) Artificial Intelligence
14 23 (10.80%) Collaborative Working
14 23 (10.80%) CRM
15 21 (9.86%) Data Science
Programming Languages
1 129 (60.56%) SQL
2 68 (31.92%) Python
3 21 (9.86%) R
4 20 (9.39%) Data Analysis Expressions
5 12 (5.63%) JavaScript
5 12 (5.63%) VBA
6 10 (4.69%) C#
7 8 (3.76%) PowerShell
8 7 (3.29%) T-SQL
9 6 (2.82%) Bash
9 6 (2.82%) PHP
10 4 (1.88%) PL/SQL
10 4 (1.88%) TypeScript
11 1 (0.47%) C++
11 1 (0.47%) Gremlin
11 1 (0.47%) LookML
11 1 (0.47%) MATLAB
11 1 (0.47%) Perl
11 1 (0.47%) SPARQL
Qualifications
1 53 (24.88%) Degree
2 15 (7.04%) ACCA
2 15 (7.04%) CIMA
2 15 (7.04%) Security Cleared
3 13 (6.10%) Computer Science Degree
3 13 (6.10%) SC Cleared
4 11 (5.16%) DBS Check
5 10 (4.69%) Master's Degree
5 10 (4.69%) Microsoft Certification
6 8 (3.76%) CISSP
7 6 (2.82%) CISA
8 5 (2.35%) CISM
9 4 (1.88%) Numerate Degree
9 4 (1.88%) PhD
10 3 (1.41%) Azure Certification
10 3 (1.41%) CRISC
11 1 (0.47%) BPSS Clearance
11 1 (0.47%) CFA
11 1 (0.47%) ISTQB
11 1 (0.47%) ISTQB Foundation Certification
Quality Assurance & Compliance
1 33 (15.49%) Data Quality
2 16 (7.51%) Accessibility
2 16 (7.51%) GDPR
3 14 (6.57%) QA
4 7 (3.29%) ISO/IEC 27001
5 5 (2.35%) NIST
6 4 (1.88%) Actionable Recommendations
6 4 (1.88%) Cyber Essentials
7 3 (1.41%) COBIT
7 3 (1.41%) GRC
7 3 (1.41%) ITGC
8 2 (0.94%) IFRS
8 2 (0.94%) WCAG
9 1 (0.47%) California Consumer Privacy Act
System Software
1 7 (3.29%) Docker
2 4 (1.88%) HDFS
Systems Management
1 7 (3.29%) Kubernetes
1 7 (3.29%) Terraform
Vendors
1 59 (27.70%) Microsoft
2 34 (15.96%) Google
3 22 (10.33%) SAP
4 20 (9.39%) Oracle
5 16 (7.51%) Salesforce
6 13 (6.10%) Databricks
7 11 (5.16%) Adaptive Insights
8 10 (4.69%) Workday
9 7 (3.29%) Cognos
10 6 (2.82%) Alteryx
11 5 (2.35%) Adobe
11 5 (2.35%) Sage
12 4 (1.88%) Teradata
12 4 (1.88%) TikTok
12 4 (1.88%) Xero
13 3 (1.41%) Amplitude
13 3 (1.41%) Sun
14 2 (0.94%) Facebook
14 2 (0.94%) Wallstreet Suite
15 1 (0.47%) Vertica